Metrics
|
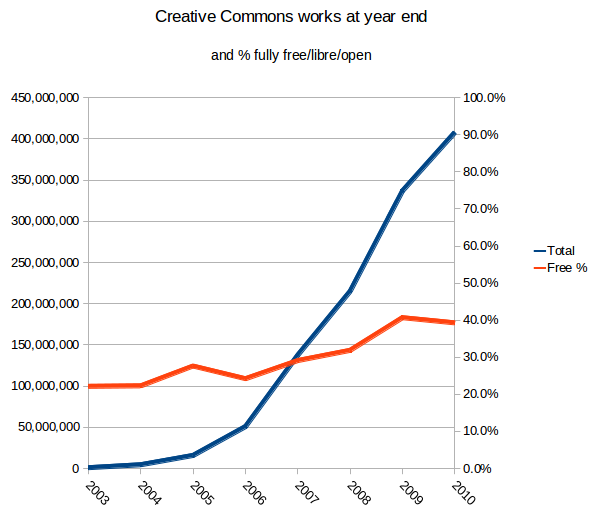
Approximate Minimum Total CC Licensed Works as of July 2008: ~130 million Yearly Growth in Millions of CC Licensed Works 2003-8. Note: data for 2008 on this chart only reflects mid-year estimates made in July |
The Metrics Portal is about gathering, processing and visualizing metrics about Creative Commons' related projects, with particular emphasis on the adoption and usage of Creative Commons licenses internationally. Join us!
The best place to communicate on this is through the cc-community mailing list for general discussion, cc-devel for technical discussion, and the #cc chat channel on irc.freenode.net. If really deep into this, please consider joining into the commons-research community. Join in the fun!
Contents
Research and Presentations
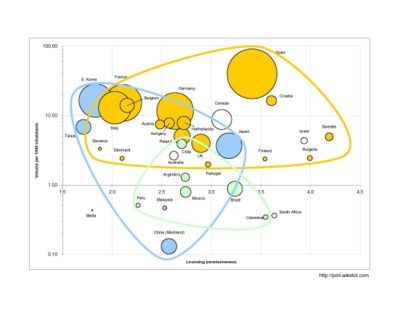
 Chart of Global CC adoption and licensing permissiveness
courtesy the Participatory Media Lab -- more visualizations available here
- Giorgos Cheliotis and the researchers at the Participatory Media Lab based at Singapore Management Univerity have been tracking and analyzing the development of Creative Commons worldwide. His 2007 TRPC paper "Taking Stock of the Creative Commons Experiment," is available here. The Lab's research wiki is a great resource for some of the latest research on CC adoption.
- Mike Linksvayer, VP of Creative Commons, has also given a few presentations in the past on the analysis and development of metrics for measuring the progress of CC licensing. Slides from those events are available on Slideshare here (from the 2008 ACIA conference) and here (from iSummit 2007).
Upcoming Events
- July 29th-August 1st -- The First Interdisciplinary Research Workshop on Free Culture will be held this year in Sapporo, Japan.
Aggregate web pages licensed
License statistics has basic information about linkback/page/search-engine-query-based license adoption statistics, as well as the code used to gather this data and dumps of the data itself.
Site-specific metrics
Content Directories lists licensed works counts for many sites that collect CC-licensed works, e.g., about 69 million at Flickr.
Counts for selected top sites over time may be found on the license statistics page.
Eventually code above should be expanded to collect this and finer-grained information (e.g., per site license breakdown) from these sites.
Quantitative metrics being prepared by Ankit as part of Summer of Code 2008
By the end of the summer, we hope to have a number of quantitative data from Ankit's Summer of Code 2008 project of analyzing our web server logs. These will hopefully include:
- Historical data on license choices at the "License your work" CC license chooser
- Indications based on referrers to our image icons to see if people change the license on web pages or other licensed documents
- Indications based on image icon loading frequency as to which licenses are used by content widely seen by users
- Analysis of search.creativecommons.org logs to see what sorts of licenses and items people search for - and if that has changed over time
- Analysis of license deeds to see if deed information affects choices in /license/
- Geographic sub-analysis of the above
- Code to reproducibly and consistently generate the above statistics.
Other quantitative metrics
- creativecommons.org traffic:
- Number of journals, publishers (e.g., PLoS)
- Feature films that have been released in theaters.
- Universities?
- Press agencies?
- Add ideas and methodology for collecting metrics here.
Qualitative metrics
- Case Studies
- Awards Received (grammys, oscars, etc)
- "bestsellers" for some definition of best-seller from Books
- Add ideas here...
Data
Creative Commons Data
- Queries against search engines for linkbacks to our licenses
- ccLearn: ODEPO Project (Open Database of Educational Projects and Organizations)
- Scrubbed Creative Commons Apache logs (eventually)
Other Datasets
- Any other data sets? Add them here...
Tools
- ccTools used for license statistic gathering
- Add your tools here!
Numbers Explanation
The Approximate Minimum Total CC Licensed Works is based on licenses reported by Yahoo search queries and Flickr and is the minimum number of licensed works that would satisfy the distribution of license types across both of them. See the estimation code.
