Difference between revisions of "Metrics/License statistics"
Paulproteus (talk | contribs) (→Caveats) |
(→Baseline numbers from specific collections) |
||
| Line 25: | Line 25: | ||
{| border="1" | {| border="1" | ||
|+ Licensed work counts at leading repositories | |+ Licensed work counts at leading repositories | ||
| − | ! Repository !! 2005-08 !! 2005-11 || 2005-12 !! 2006-01 || 2006-04 || 2006-05 || 2006-07 || 2006-09 || 2006-12 || 2007-03 || 2007-06 | + | ! Repository !! 2005-08 !! 2005-11 || 2005-12 !! 2006-01 || 2006-04 || 2006-05 || 2006-07 || 2006-09 || 2006-12 || 2007-03 || 2007-06 || 2008-01 |
|- | |- | ||
! [http://flickr.com/creativecommons Flickr] ([http://www.swivel.com/graphs/show/16858232 graph]) (photos) | ! [http://flickr.com/creativecommons Flickr] ([http://www.swivel.com/graphs/show/16858232 graph]) (photos) | ||
| − | | 4.1m || || 7.1m || || 10.8m || 12.7m || || 19.7m || 25.5m || 32.5m || 38.7m | + | | 4.1m || || 7.1m || || 10.8m || 12.7m || || 19.7m || 25.5m || 32.5m || 38.7m || 57.9 |
|- | |- | ||
! [http://www.soundclick.com/business/license_list.cfm Soundclick] ([http://www.swivel.com/graphs/show/16860809 graph]) (audio) | ! [http://www.soundclick.com/business/license_list.cfm Soundclick] ([http://www.swivel.com/graphs/show/16860809 graph]) (audio) | ||
| − | | 159k || || || 200k || 220k || || 249k || || 294k || 324k || 372k | + | | 159k || || || 200k || 220k || || 249k || || 294k || 324k || 372k || 430k |
|- | |- | ||
! [http://revver.com Revver] ([http://www.swivel.com/graphs/show/16860811 graph]) (video) | ! [http://revver.com Revver] ([http://www.swivel.com/graphs/show/16860811 graph]) (video) | ||
| − | | na || 0 || || || 19k || || || || 119k || 214k || 296k | + | | na || 0 || || || 19k || || || || 119k || 214k || 296k || 417k |
|} | |} | ||
Revision as of 23:53, 19 January 2008
Contents
Caveats
Estimating license adoption is a very inexact science. There is no authoritative source and we neither control nor have inside knowledge of the construction and volatility of the most comprehensive sources -- web search engines. From 2003 through 2005 we relied primarily on Yahoo! link: queries (Google's link: operator obtains very incomplete results). In late 2005 Google added CC queries via their advanced search page and also via their API (Yahoo! also allows this, but in this case Google's results seem more comprehensive).
Linkback queries and CC API queries
Data
You can download raw mysql dumps that are generated nightly from http://labs.creativecommons.org/~paulproteus/sql-dumps/all.sql.gz . This includes the schema, which is necessary to run our stats code.
Software
In order to use the above dumps, you must:
- Import the above dump into MySQL
- Download our stats module from Subversion
- Configure the database in dbconfig.py
- Run chart generation software from the stats/reports/ directory.
That's it!
Baseline numbers from specific collections
We can also know the number of works licensed at various content curators. The largest of these based on recent (December 2006) for various formats may (there could easily be a larger CC-licensed video collection than Revver) be:
| Repository | 2005-08 | 2005-11 | 2005-12 | 2006-01 | 2006-04 | 2006-05 | 2006-07 | 2006-09 | 2006-12 | 2007-03 | 2007-06 | 2008-01 |
|---|---|---|---|---|---|---|---|---|---|---|---|---|
| Flickr (graph) (photos) | 4.1m | 7.1m | 10.8m | 12.7m | 19.7m | 25.5m | 32.5m | 38.7m | 57.9 | |||
| Soundclick (graph) (audio) | 159k | 200k | 220k | 249k | 294k | 324k | 372k | 430k | ||||
| Revver (graph) (video) | na | 0 | 19k | 119k | 214k | 296k | 417k |
Also see Jamendo stats and Magnatune stats.
License property charts
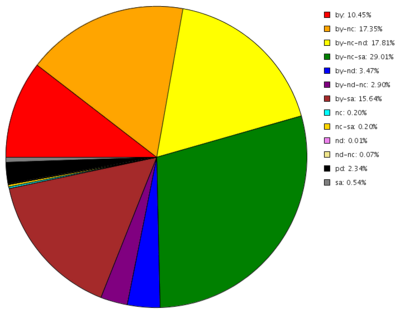
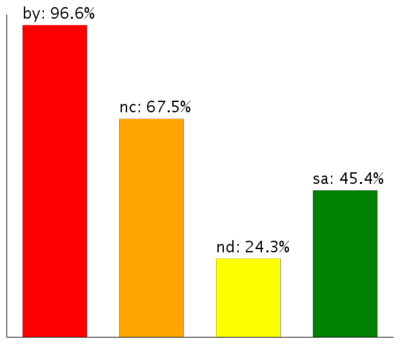
These charts show a breakdown of the types of licenses deployed and the properties of deployed licenses, based on Yahoo! queries as of 2006-06-13. (As above the Google API is now superior for an aggregate count, but Yahoo link: searches are superior for measuring the relative deployment of specific licenses and thus specific license types.)

Estimates over time
2007-06-14 -- Multifaceted metrics presented at iSummit [1]
2007-03-31 -- 33 million photos licensed at Flickr and growth over 1 year [2]
- Based on a swivel.com user's data collection from http://flickr.com/creativecommons
2006-06-13 -- 140 million pages licensed [3]
- Based on Google queries.
2005-12 -- 45 million pages licensed [4]
- Based on Google queries.
2005-08-09 -- 53 million pages licensed [5]
- Again based on Yahoo! queries, this number turned out to be overstated as Yahoo! tuned their results estimation after growing their index.
2005-06-13 -- CC search query breakdown[6]
- Breakdown of search requests and desired license properties -- people searching for video want the least freedom.
2005-05-27 -- CC in Yahoo! Advanced Search[7]
- Yahoo! queries say 16m pages linking to a CC license.
2005-03-23 -- Yahoo! Search for Creative Commons[8]
- Close to 14m pages link to a CC license according to Yahoo! queries.
2005-03-07 -- CC search index breakdown[9]
- Breakdown of (small) CC-nutch index -- audio publishers are most permissive, video publishers least.
2005-02-25 -- License Distribution [10]
- Based on Yahoo! queries there are now 10m licensed documents. Pie chart of what those licenses are.
2005-02-18 -- How many pages link to a CC license? [11]
- Based on Yahoo! queries, "well over 5m." At the end of 2003 it was 1m.
2004-09-17 -- Searching for Creative Commons on Yahoo![12]
- 4.7m pages link to CC licenses according to Yahoo! queries.
2003-12
- 1m
